The best NetBox diagram tool depends on who reads the drawing. To see cabling inside NetBox, install the free netbox-topology-views plugin (Apache-2.0, 5.0.0 for NetBox 4.7). To keep hand-drawn draw.io files with the devices they show, use netbox-drawio. For a printable drawing set with security zones, VLAN tables, a flow register and a drift report, run NetDiagrams (free, Apache-2.0): pip install netdiagrams, then netdiagrams. Discovery tools such as Scanopy map the network without NetBox. Checked November 3, 2026.
The table
Every fact below was checked on November 3, 2026 against the project's PyPI page or the vendor's own pricing page. Plugins move fast, so check the version you need against your NetBox release before you install.
| Option | Price | Licence | Latest release | Reads NetBox? | Output | Audit use |
|---|---|---|---|---|---|---|
| NetBox on its own | Free | Apache-2.0 | Ships with NetBox | It is NetBox | Rack elevations, cable traces | Rack and cabling evidence only |
| netbox-topology-views | Free | Apache-2.0 | 5.0.0, Oct 19, 2026 (for NetBox 4.7) | Yes, cables | Interactive map; PNG or draw.io XML export | What connects to what |
| NextBox UI | Free | MIT | 1.0.7, Dec 1, 2024 (lists NetBox 4.1) | Yes, cables | Interactive auto-layout map | What connects to what |
| netbox-drawio | Free | Apache-2.0 | 0.2.3, Oct 2, 2026 (NetBox 4.7, Python 3.12+) | Stores drawings, doesn't draw them | draw.io editor inside NetBox | Keeps hand drawings next to the devices |
| netbox-diagram | Free | MIT on PyPI (README badge says AGPL-3.0) | 0.0.2, Oct 7, 2025 | Yes, devices, cables, circuits | Diagram tab, devices placed by X/Y | Small hand-picked views |
| Paid hosted NetBox editions | Part of paid plans | Proprietary | Vendor-managed | Yes | Visual explorer in the hosted service | Depends on plan |
| A script of your own | Your time | Yours | You decide | Yes, via pynetbox (7.9.0) | Whatever Graphviz or draw.io XML you write | Whatever you build |
| draw.io by hand | Free | Apache-2.0 | Released often | No | Any drawing | Only as true as the last edit |
| Scanopy | Free self-hosted edition (one site, one user); cloud from $79.99/month billed yearly; self-hosted from $4,000/year | Open-source edition plus commercial | Hosted service | No, it scans the network | Live L2 and L3 maps; draw.io, Visio, PDF export | Sold for NIS2, ISO 27001, HIPAA and CMMC evidence |
| NetDiagrams | Free | Apache-2.0 | 0.2.1, Oct 30, 2026 | Yes, read-only token | Up to 11-page draw.io drawing set per site, flow register, drift report | Zones, enforcing firewalls, flows, evidence dates |
NetDiagrams is ours, so read its row with that in mind. The rest of this page says where each of the others is the better pick.
What each one is good at
NetBox on its own. Rack elevations and cable traces come free with every install, and for a cabling question they are the fastest answer. NetBox has no whole-network view, so everything past one rack or one cable comes from a plugin or a tool that reads its API. More on that in NetBox topology view.
netbox-topology-views. The best-known way to see your cabling as a graph inside NetBox. It builds the map from the cables you recorded, filters by name, site, tag or role, and exports PNG or draw.io XML. It is the right first install for most teams. Its version table pins each release to one NetBox release, so an upgrade of NetBox waits for the plugin.
NextBox UI. A topology plugin with a stronger auto-layout engine, which helps on big flat sites. Its PyPI page lists NetBox 4.1 for the current 1.x line and the last release was December 2024, so test it on a copy of your NetBox before you rely on it.
netbox-drawio. Not a generator: it embeds the draw.io editor in NetBox and lets one drawing link to every device, site and circuit it shows. Pick it if your drawings are made by hand and the problem is that nobody can find them.
netbox-diagram. Adds a diagram tab built from devices, cables and circuits, placed by X and Y coordinates. It is an early 0.0.x release and its own README says it doesn't draw virtual machines, power or patch panels.
Paid hosted NetBox editions. If you already pay for a hosted NetBox, try its visual tools first: they are supported and need no install. Everything else on this page works with the free NetBox you host yourself.
A script of your own. pynetbox plus Graphviz will draw one specific picture well, and many teams start there. The cost comes later, when the script has to handle every site's exceptions and nobody owns it.
draw.io by hand. Still the default for a reason: free, fast and it draws anything. A hand drawing goes stale on the first change nobody copies across, which is the problem NetBox was bought to solve.
Scanopy. It doesn't use NetBox at all. A scanner discovers hosts, services and switch data and keeps a live map. That suits a team with no source of truth yet, or one that wants discovery to check the source of truth. If NetBox is already your record, you will be maintaining two.
NetDiagrams. Reads NetBox with a read-only token and writes a finished draw.io drawing set per site: an overview in plain words, logical page with zones and VLAN tables, physical page, hardware, wireless, flows, failover, a flow register and a drift report listing what NetBox is missing. Industry profiles change the zones and pages for offices, stores, banks, plants and six other kinds of site. It is not interactive and not live: you run it again when NetBox changes.
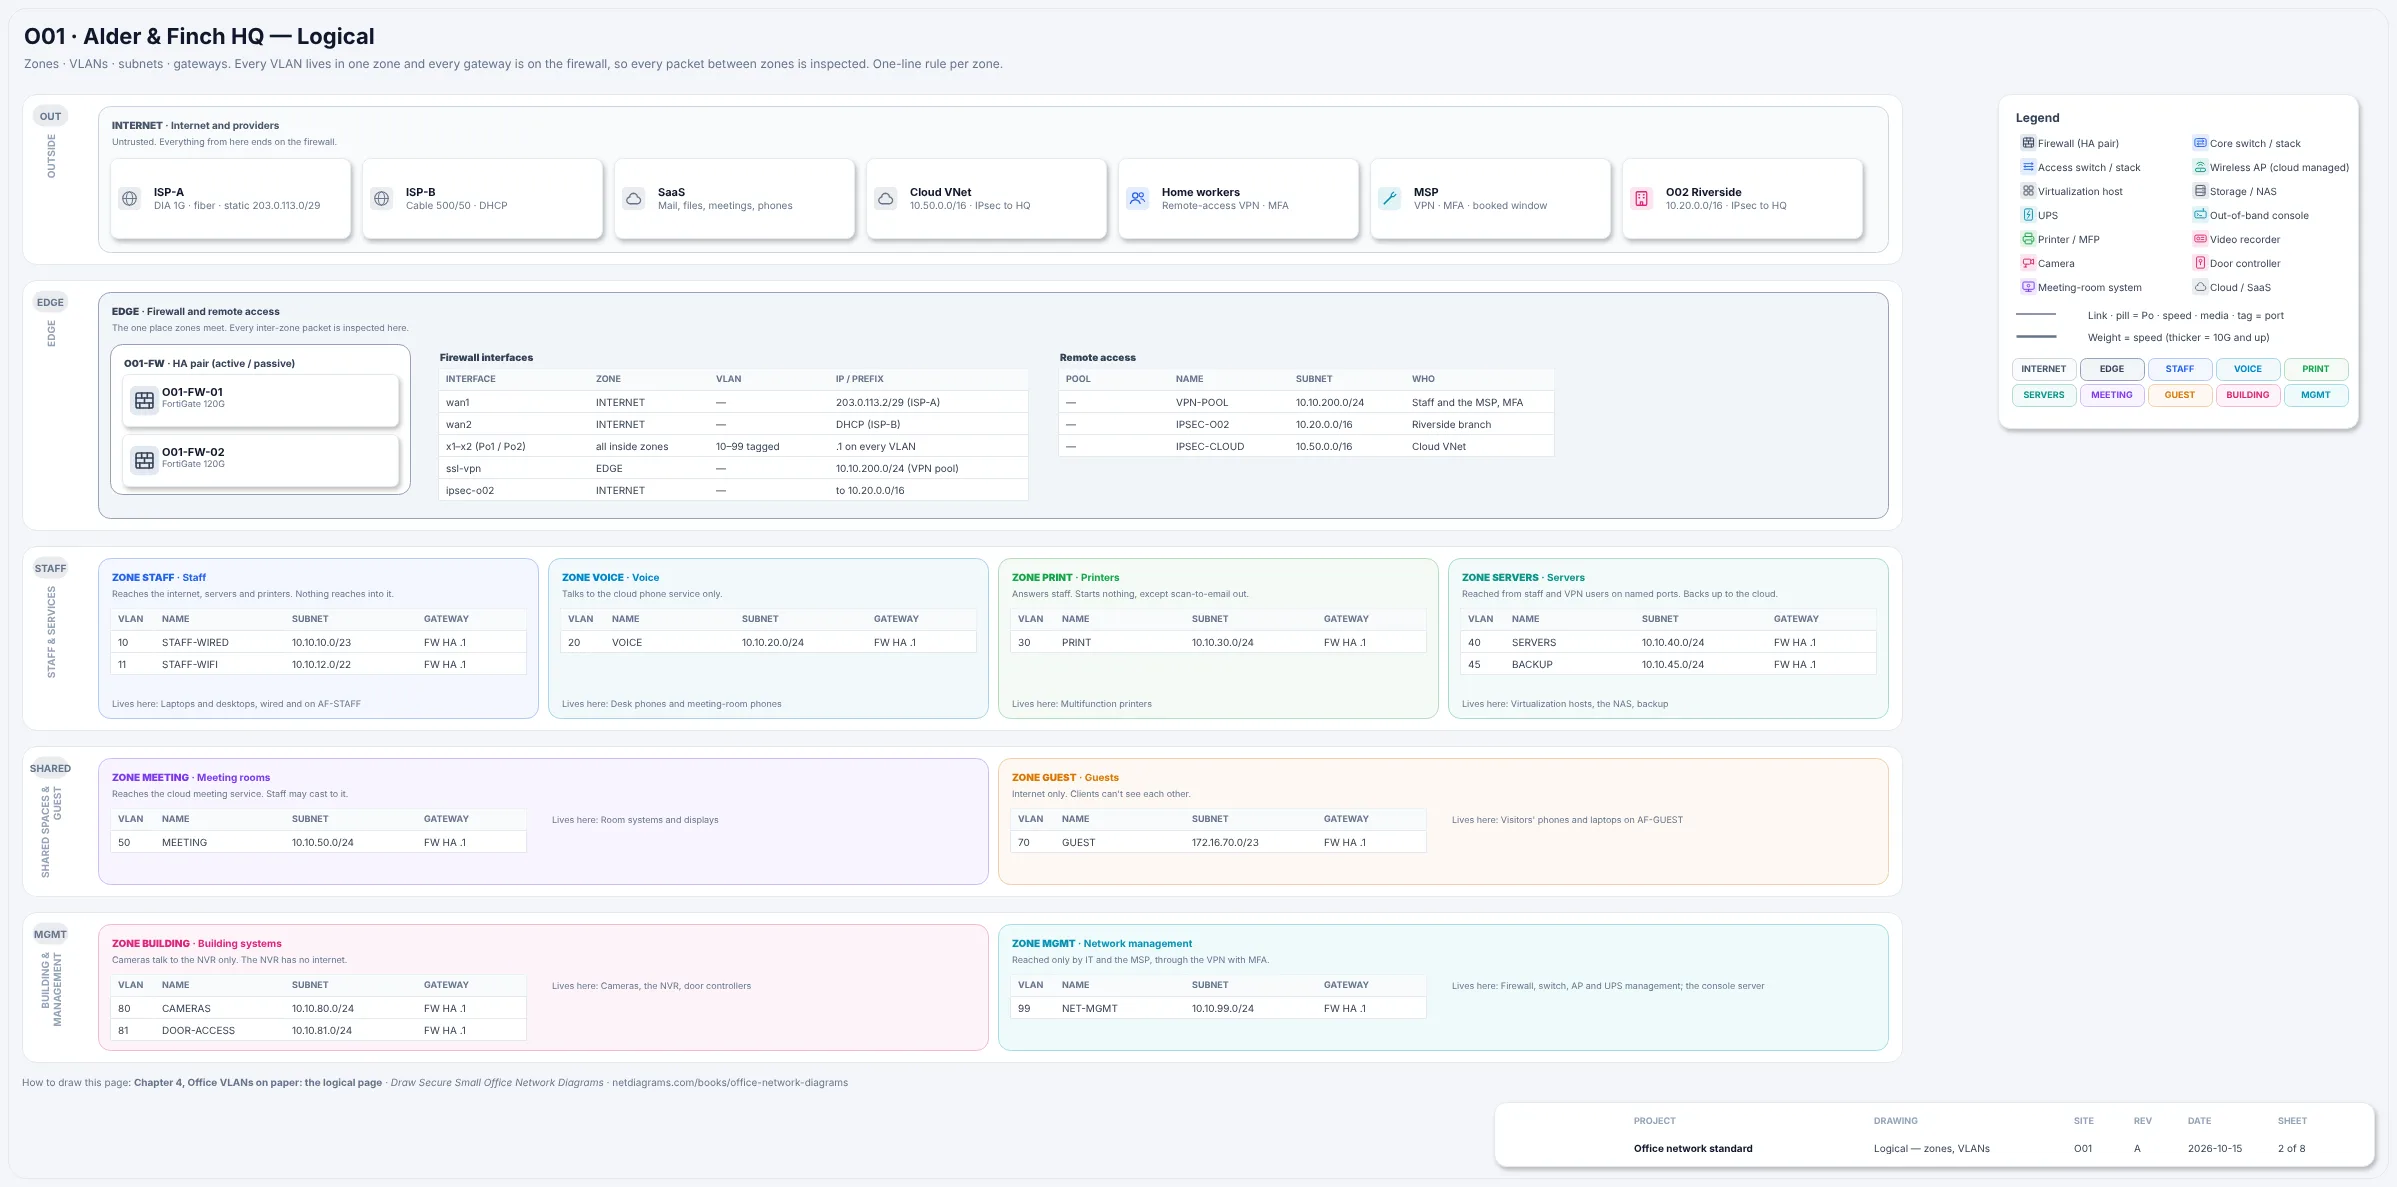
The logical page of the sample office in Book 5, drawn from its NetBox data: one box per security zone, each with its VLAN table.
How to choose
- You want to see the cabling inside NetBox: netbox-topology-views. Add NextBox UI only if you need its layout and it supports your NetBox release.
- You draw by hand and can't find the drawings: netbox-drawio.
- You have no source of truth and want one built from the network: a discovery tool such as Scanopy, or load NetBox from your switches first.
- Someone outside the team will read the drawing (an auditor, an insurer, a vendor, a new hire): you need zones, the firewall on each boundary and a list of what may cross it. That is what NetDiagrams is built for:
pip install netdiagrams, thennetdiagrams. - You need more than one: they don't conflict. The plugins live inside NetBox and NetDiagrams only reads it.
Sizing it to your network? See NetBox diagrams for a small network and NetBox diagrams for multi-site networks.
The question none of them answer
Every tool here draws what NetBox, or the network, says exists. None can tell you whether the firewall actually enforces the zones the drawing shows. A rule added during an outage can open a path the diagram says isn't there, and the drawing stays clean.
That check runs on the firewall config. SegAudit reads a PAN-OS, FortiOS, Cisco ASA, Cisco FTD or Check Point export on your own machine and lists the rules that cross your zones.
Where to go next
- Network Diagrams by Industry: ten field guides, one per kind of site, that decide the zones before you draw them, with a free chapter each.
- How to draw a network diagram from NetBox, step by step.
- Open source network diagram software compared, past NetBox: Graphviz, Mermaid, D2.
NetBox is a trademark of its owner and is named here only to describe compatibility. NetDiagrams is not affiliated with NetBox, Scanopy or the plugins named on this page. Prices and releases change; the dates above are when we checked.